Value Stream Mapping Manufacturing: value stream mapping manufacturing Lean
Discover value stream mapping manufacturing to eliminate waste, streamline processes, and cut costs in your production line.

Value Stream Mapping, or VSM, is a lean management tool used to get a high-level view of the entire production process. It’s about charting every single step that takes a product from raw material to the hands of a customer. The whole point is to hunt down and eliminate "waste" within that chain of events, making the entire system more efficient.
Unlocking Efficiency with Value Stream Mapping Manufacturing
Imagine your production line is a river. Raw materials enter at the source, and the finished product flows out to the customer at the mouth. Along the way, some parts of that river are swift and clear, while others are slow, murky, and full of snags. Value stream mapping is like getting a satellite view of that entire river, showing you exactly where the logjams are slowing everything down.
This isn't just another flowchart. A VSM is a powerful visualization tool that captures both the physical movement of materials and the flow of information that controls that movement. It’s this dual perspective that really separates it from other process analysis methods.
Differentiating Value from Waste
At its core, VSM forces you to look at every activity and ask a simple question: does this add value for the customer?
A value-added step is any action that physically transforms the product in a way the customer is willing to pay for—think assembly, painting, or testing. Anything else, from waiting for parts to moving pallets across the warehouse, is considered non-value-added waste.
The goal of value stream mapping is to create a lean, efficient process by systematically identifying and eliminating non-value-added activities. It provides a blueprint for transforming your current state into an optimized future state.
By mapping every task, delay, and handoff, VSM gives you a clear, data-driven picture of what’s really happening on your shop floor. It moves you from thinking you know where the problems are to seeing them quantified in black and white.
The Scope of VSM in Production
A proper value stream map doesn’t just focus on one department; it captures the end-to-end journey. This holistic view often includes:
- Supplier Interactions: The process starts the moment you order materials.
- Internal Processes: Every step inside your four walls—receiving, warehousing, kitting, assembly, and quality control.
- Information Flow: The path of work orders, production schedules, and shipping notices that dictate the physical work.
- Customer Delivery: The final logistics to get the product where it needs to go.
This wide-angle lens allows leaders to see how different parts of the operation connect and create bottlenecks for each other. It’s a foundational piece of any lean operation. To see how these ideas fit into a larger strategy, you can learn more about how lean manufacturing and 3PL work together to cut costs. This comprehensive approach makes value stream mapping manufacturing an essential tool for any company serious about operational excellence.
How to Spot the 8 Hidden Wastes in Your Production Line
To really get the most out of value stream mapping in manufacturing, you have to learn to see your production floor with fresh eyes. It's about developing a lens that makes waste—the real, hidden waste—pop out. In the world of lean, waste isn't just a pile of scrap in the corner. It's any activity that eats up resources but adds zero value for the person paying for the final product.
These inefficiencies are the silent killers of profitability, quietly inflating your costs and pushing back delivery dates.
The eight most common wastes are neatly summed up by the acronym DOWNTIME. Learning to spot them is the essential first step before you can even think about eliminating them. Your value stream map is the tool you'll use to hunt them down, turning vague operational headaches into hard data you can actually do something about.
Identifying the 8 Wastes of Lean Manufacturing
Before you can fix the leaks in your value stream, you need to know exactly what you’re looking for. The 8 Wastes, often called "muda" in Japanese, are the specific targets. They are the symptoms of deeper process problems that add cost and time without adding a single ounce of value for your customer. The table below breaks down each one, showing you what it looks like on the floor and how it impacts your bottom line.
Think of these wastes as interconnected. Overproduction, for instance, inevitably leads to excess Inventory and Transportation. By learning to see one, you’ll quickly start seeing the others. This is the foundation of building a truly lean operation.
A Deeper Look at the Most Common Culprits
While all eight wastes are important, a few of them tend to cause the most significant damage in assembly and logistics environments.
Defects: The Obvious Cost of Rework
Defects are probably the easiest waste to understand. This is any part, product, or service that doesn't hit the quality mark, forcing you to either fix it or throw it away. Every single defect sets off a chain reaction of waste—you burn through more materials, eat up more labor hours, and throw your production schedule into chaos.
In an assembly setting, a defect might be a simple misaligned component. But that one mistake forces an operator to stop, take the unit apart, and put it back together correctly. In kitting, it could be a single wrong part in a bin, which might not be caught until it brings the entire assembly line to a screeching halt. These errors aren't just about wasted parts; they chip away at your credibility and your customers' trust.
Overproduction: The Sneakiest Waste of All
Many lean experts call overproduction the most dangerous waste, and for good reason. It’s when you make more of something—or make it earlier—than is immediately needed. This one bad habit creates a domino effect, leading directly to massive inventory piles that hide a multitude of other sins, like defects and equipment problems.
Imagine an assembly station cranking out 100 sub-assemblies when the schedule only calls for 80. Those extra 20 units are now a liability. They have to be stored, moved, and tracked, tying up space and cash that could be put to better use. This "just in case" mindset is the polar opposite of the "just in time" philosophy that drives efficient, lean operations.
"Overproduction leads to the other wastes. By producing components before they are needed, you create excessive lead times, large inventories, and delays, all of which hide underlying problems in your value stream."
Waiting: The High Cost of Standing Still
Waiting is any time your people or machines are sitting idle. It’s the dead space in your process. This happens when your workflow is unbalanced, creating bottlenecks where one station is starved for work while another is buried. It's a crystal-clear sign of a process that’s out of sync.
You see it everywhere once you start looking:
- An assembly operator waiting for a kitting cart to arrive.
- A machine powered down, waiting for a lengthy setup changeover.
- Finished goods stacked up, waiting for a forklift to move them into the warehouse.
Every minute spent waiting is a minute of productive capacity you'll never get back.
Non-Utilized Talent: The Human Cost of Inefficiency
This is one of the most overlooked but damaging wastes. It’s the failure to tap into the brainpower, skills, and creativity of your own team. You see it most often in old-school, top-down cultures where people are just told what to do, with no room for feedback. Wasting talent isn't just inefficient—it's a killer for morale.
When the operators who are hands-on with a process every single day aren't asked for their ideas on how to make it better, you're leaving an incredible amount of insight on the table. A true lean culture empowers everyone to spot waste and suggest solutions, effectively turning your entire workforce into an army of problem-solvers. This is a non-negotiable part of making value stream mapping in manufacturing actually work.
Your Step-By-Step Guide to Conducting a VSM Analysis
Alright, you know what waste looks like on your production line. Now, it's time to turn that insight into action. A value stream mapping analysis isn't just a theoretical exercise; it’s a hands-on, strategic way to systematically find and dismantle inefficiency. Think of it as creating a detailed battle plan before you go to war with waste.
This guide walks you through the entire VSM process, broken down into five clear, actionable stages. We’ll go from the big picture of selecting a product line all the way down to the nitty-gritty of implementation, giving you a solid framework for building a leaner, more responsive operation.
Step 1: Select a Product Family
First things first: you can’t map everything at once. Trying to do so is a recipe for disaster. The most critical first step is to pick a single, high-impact product family to focus on. A product family is simply a group of products that go through similar processing steps and share common equipment.
A great way to start is by running a Product Quantity-Process Matrix (sometimes called a PQPR analysis). This tool helps you group products by their production volume and process flow, making it much easier to spot a logical starting point. Zero in on a high-volume family or one that is strategically critical to your most important customers. By narrowing your focus, you keep the project manageable and set yourself up for a meaningful, tangible win.
Step 2: Map the Current State
This is where the real work begins. Your goal here is to document how your process actually works today—not how the manual says it should work. To do that, you have to get out on the floor for a gemba walk, a Japanese term that literally means "going to the real place."
You need to physically walk the production floor with a cross-functional team. Don't do this alone. Your team should include people from every part of the value stream: operators, supervisors, material handlers, and quality control folks. As you walk the line from shipping all the way back to receiving, you'll be gathering critical data at each process step.
Key data points you absolutely must collect include:
- Cycle Time (C/T): How long it takes to complete one unit at a specific station.
- Changeover Time (C/O): The time it takes to switch from making one product to another.
- Uptime: The percentage of time a machine is actually available and running.
- Inventory Levels: The amount of work-in-progress (WIP) sitting between each step.
Using a standardized set of VSM icons, your team will draw the map on a large whiteboard or with sticky notes, visualizing both the material flow and the information flow. This simple visual makes bottlenecks and delays immediately obvious to everyone in the room.
Step 3: Identify Waste and Analyze the Flow
With your current state map complete, the team can now really dig in and pinpoint the sources of waste. This is the moment you connect those "DOWNTIME" wastes we talked about to real, hard numbers. You'll calculate the total lead time from start to finish and compare it to the actual value-added processing time.
The gap between these two numbers is often shocking.
For example, you might discover that a product has a total lead time of 15 days but only gets 20 minutes of actual value-added work done on it. The rest of that time is pure waste—mostly waiting around in a queue or sitting as inventory.
This diagram perfectly captures the core philosophy behind this process.
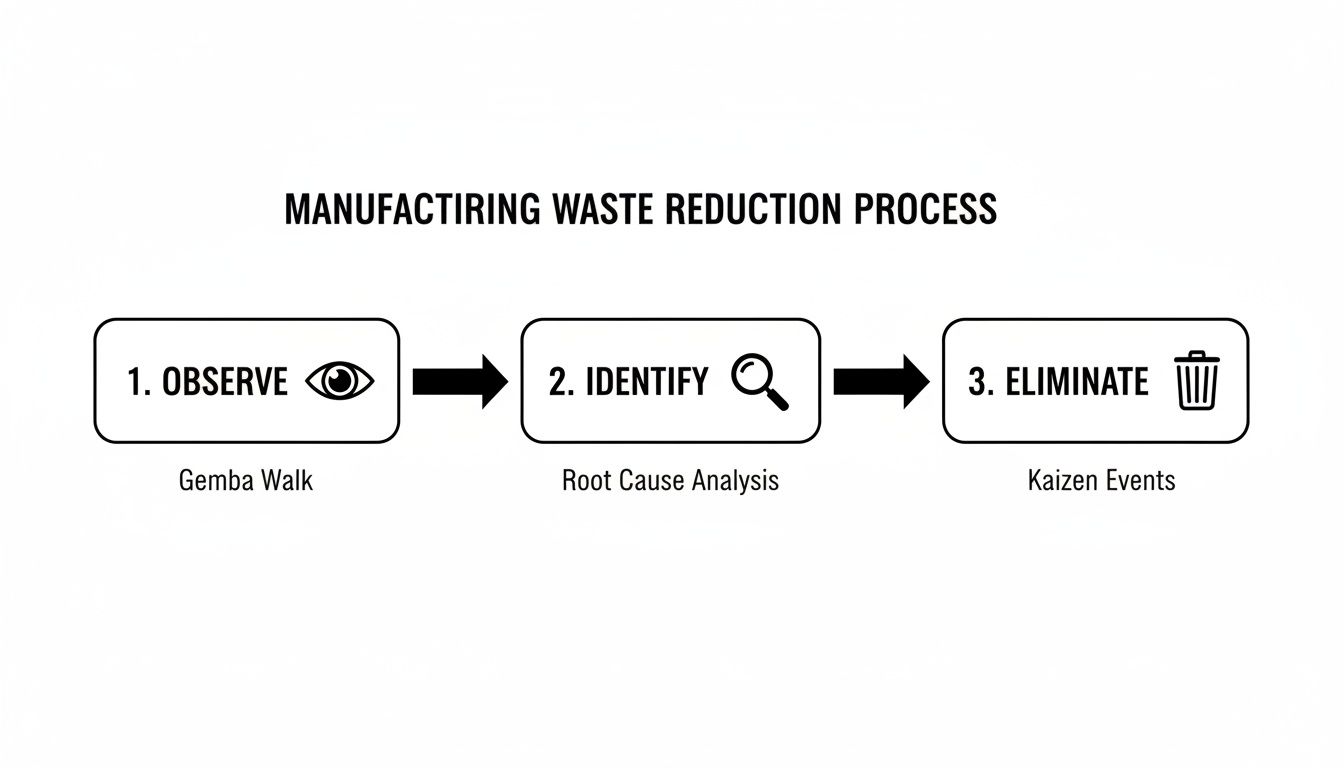
It’s a powerful but simple loop: get out there and observe the workflow, use data to identify exactly what's holding you back, and then systematically get rid of it.
Look for the most common problem areas:
- Where is inventory piling up?
- Which process has the longest cycle time (this is your bottleneck)?
- Are there excessive, unnecessary transport steps between stations?
- How much time are you losing to machine changeovers?
This data-driven approach moves the conversation away from opinions and squarely onto facts, getting everyone aligned on what truly needs to be fixed.
Step 4: Design the Future State
Now for the creative part: designing a leaner, more efficient process. The future state map is your vision for what the value stream could look like. It’s not a pipe dream; it should be an achievable goal you can hit within a reasonable timeframe, usually 6-12 months.
Here, the team brainstorms improvements grounded in lean principles. The main objective is to create a continuous flow wherever possible, getting rid of the large batches and long queues that plague the current state.
A well-designed future state map focuses on establishing a "pull" system. Instead of pushing work into the system based on a forecast, each downstream process signals its need to the upstream process, pulling work forward only when capacity is available.
Some of the most common improvements you’ll see in a future state map include:
- Implementing a Pull System: Using Kanban signals to control inventory between steps.
- Creating Continuous Flow: Arranging workstations in a cell to process one unit at a time.
- Leveling Production (Heijunka): Smoothing out the production schedule to create a more stable and predictable workflow.
This new map becomes your blueprint for action.
Step 5: Create and Implement the Plan
A beautiful future state map is useless if it just sits on a whiteboard. The final step is to break down the required changes into actionable, measurable projects. This is often done using a "Kaizen burst" or another type of rapid improvement event.
For each improvement loop you identified on your map, create a mini-project charter. Assign an owner, set a clear deadline, and define the key metrics you’ll use to measure success. For instance, one project might be to reduce the changeover time on a specific machine by 50%, while another could focus on redesigning a workstation layout to eliminate wasted motion.
The impact of this disciplined approach can be massive. On average, manufacturers who adopt VSM report a 46% reduction in lead times, turning cycles that took weeks into mere days and boosting on-time delivery rates to over 95%. In one real-world case, a pharmaceutical firm used VSM to map its processes and found bottlenecks in handoffs and transactions. The result? A 28% increase in manufacturing throughput, all without spending a dime on new capital equipment. You can find more data on mastering manufacturing excellence on machdatum.com.
The key is to treat VSM not as a one-time event, but as the beginning of a continuous improvement culture. Before you know it, your future state map will become your new current state, ready for the next round of analysis and optimization.
Applying VSM to Assembly Kitting and Sequencing
Theory is one thing, but the real power of value stream mapping in manufacturing snaps into focus when you apply it to a complex, fast-paced operation. Assembly, kitting, and sequencing are perfect examples—environments where dozens of tiny inefficiencies can quickly snowball into major delays and cost overruns.
For many Tier 1 suppliers, these operations are the nerve center of their business. Getting them right isn't just about efficiency; it's about survival. Even a small improvement can have a massive ripple effect on throughput and profitability.
Let's walk through a realistic scenario to see how this plays out. Imagine a typical Tier 1 automotive supplier that provides sequenced interior component kits to a major OEM assembly line. Their process works, but they're struggling. Labor costs are high, they occasionally cause line-side shortages, and their work-in-progress (WIP) inventory is through the roof.
The Current State: An Inefficient Kitting Process
The supplier’s cross-functional team gets to work, starting with a map of their current state. They physically walk the floor, tracing the entire process from the moment the OEM broadcast signal is received to the moment the finished kit is loaded onto a truck.
The resulting map is… revealing. It paints an unflattering but honest picture, exposing several sources of waste that everyone had just accepted as "the cost of doing business."
- Excessive Transportation and Motion: The warehouse layout is a mess. Pickers follow long, winding paths to gather all the components for a single kit. We're talking miles of walking per shift, all of which adds zero value and drives up labor costs.
- Waiting: The map shines a bright light on a huge bottleneck at the consolidation station. Pickers often show up with partial kits and have to stand around, waiting for other parts to arrive before the final kit can be assembled and inspected. All that idle time is a direct hit to productivity.
- Inventory: To prevent shortages at the OEM, the supplier overstocks high-use components near the kitting area. It’s a classic case of a band-aid solution. While it stops line stoppages, it also ties up a ton of cash and eats up valuable floor space. The VSM data shows some parts have an inventory turn of less than four times per year—a clear sign of bloat.
The timeline at the bottom of the map is the real smoking gun. The total lead time from order to shipment is 24 hours. But the actual value-added time—the hands-on work of picking and assembling the kit—is a mere 12 minutes. That massive gap is almost pure, non-value-added waste.
Designing a Leaner Future State
With the problems now clearly identified and quantified, the team can shift its focus to designing a future state map. The goal isn't to create a perfect process overnight. It's to build a realistic, achievable plan that directly attacks the biggest sources of waste they just uncovered.
The future state map introduces three fundamental changes:
- Redesigned Work Cell: First, they propose a U-shaped kitting cell. High-volume parts are placed on gravity-fed racks right at the point of use, completely eliminating those long walks. This cellular layout is specifically designed for one-piece flow, allowing a single kit to move smoothly through the process without ever stopping to wait.
- Implementation of a Pull System: Instead of pushing huge batches of parts to the kitting area "just in case," they design a two-bin Kanban system. When a picker empties the primary bin for a component, that empty bin becomes the signal for a material handler to replenish it. This simple visual cue drastically reduces WIP and ensures parts are only moved when they are actually needed.
- Standardized Work: The team creates simple, visual work instructions for the entire kitting and inspection process. This ensures every kit is built exactly the same way, every time. It not only reduces the risk of defects but also makes training new team members significantly easier.
These aren't just ideas on a whiteboard; they are concrete, actionable steps. You can see how this kind of structured process leads to greater efficiency in our guide to kitting and assembly services, where precision is everything.
The future state map is a strategic roadmap. It visualizes how targeted lean interventions—like a pull system and standardized work—can transform a disjointed process into a smooth, continuous flow of value directly to the customer.
The projected impact is huge. The future state timeline estimates a drop in total lead time from 24 hours down to just four hours. This doesn’t just make them more responsive; it directly lowers labor costs by getting rid of all that wasted motion and waiting.
On top of that, the Kanban system is projected to slash on-hand inventory for kitting components by over 60%, freeing up both cash and critical floor space. This is a perfect example of how value stream mapping manufacturing provides the clarity needed to make smart, data-driven improvements that stick.
The Metrics and Tools That Make or Break a Value Stream Map
A great value stream map is built on hard data, not just observation. If you really want to understand what's happening on your floor, you have to move beyond general feelings and start measuring what actually matters. This is where we get into the essential metrics and tools you'll need to run a proper value stream mapping manufacturing analysis.
Think of these metrics as the vital signs of your entire production process. They tell you exactly where your operation is healthy and where it’s struggling, letting you make precise, surgical improvements instead of just taking shots in the dark. Without data, your map is just a drawing; with it, it becomes a powerful diagnostic tool.
Must-Have Metrics for Your VSM
Certain key performance indicators (KPIs) are completely non-negotiable for a serious VSM project. They create the quantitative backbone for your analysis, showing you the real gap between how you’re performing today and what you're truly capable of.
Here are the core metrics you absolutely have to capture:
- Lead Time (LT): This is the big one. It’s the total time it takes for a single unit to get all the way through your system—from the moment an order is placed to final delivery. Lead time is what your customer actually experiences, and it includes both value-added work and all the wasteful waiting in between.
- Cycle Time (C/T): This is a more granular metric, measuring the time it takes to complete one unit at a specific workstation or step. When you find the process with the longest cycle time, you’ve just found your primary bottleneck—the one step that’s capping the output of your entire line.
- Takt Time: This isn't something you measure on the floor; it's a calculation based on customer demand. Takt time is the rhythm, the beat you need to hit to meet your orders. You calculate it like this: Takt Time = Available Production Time / Customer Demand. Comparing your cycle times to your takt time immediately tells you if you can keep up.
- Overall Equipment Effectiveness (OEE): For any process that relies on machinery, OEE is critical. It’s a composite score that measures a machine's true productivity by looking at three things: Availability (uptime vs. downtime), Performance (how fast it’s running vs. its potential speed), and Quality (good parts vs. rejects). A perfect, flawless process would have an OEE score of 100%.
When you meticulously collect these data points during your gemba walk, you stop debating opinions and start dealing with facts. This data-driven approach is the only way to find the real root causes of waste and build a rock-solid case for change.
The value of tracking these numbers is well-documented. For OEMs and Tier 1 suppliers in tough sectors like agriculture and energy, VSM initiatives that zero in on key metrics—including cycle times, OEE, and inventory turns—have driven 21% overall productivity increases. This builds on the legacy started by Toyota, which famously used these very principles to slash lead times by 46%. You can learn more about how digital tools amplify these results in this analysis of supply chain optimization from ascm.org.
The Right Tools for the Mapping Job
Once you know what you're measuring, you need the right tools to bring your map to life. The tools you pick can be as simple as a pen and paper or as sophisticated as a cloud-based software suite. It all depends on the complexity of your operation and what your team needs to succeed.
The Classic Approach: Paper and Sticky Notes
Never underestimate the power of the basics. For many teams, the best way to hammer out a current state map is with a giant sheet of butcher paper, a whiteboard, and a few packs of sticky notes. It’s a hands-on, collaborative method that’s fantastic for getting everyone in a room, brainstorming, and physically building the map together.
It's low-cost and incredibly high-engagement. There's something powerful about the physical act of moving sticky notes around—it makes it easy to visualize changes and test out different ideas for the future state on the fly.
Modern VSM Software Solutions
When you're dealing with more complex value streams or have a team spread across different locations, digital VSM software can be a game-changer. These tools offer some real advantages over the manual approach:
- Standardized Symbols: They come with a built-in library of standard VSM icons, which keeps your maps consistent, clear, and easy for anyone to read.
- Easy Collaboration: Cloud-based platforms like Lucidchart or Miro let team members from different sites view, comment on, and edit the map in real-time.
- Data Integration: More advanced tools can plug directly into your ERP or MES, automatically pulling in live data for metrics like inventory levels and cycle times.
- Future State Simulation: This is where digital tools really shine. They let you build a future state map and run "what-if" scenarios. You can model the impact of slashing a bottleneck's cycle time or adding a Kanban system before you ever commit to moving a single machine on the floor.
In the end, the best tool is the one your team will actually use. Whether you go with a high-tech digital solution or a low-tech whiteboard, the goal is always the same: to create a clear, data-rich picture of your value stream that empowers your team to hunt down waste and serve your customers better.
Moving from a One-Time Fix to Continuous Improvement
It’s easy to fall into the trap of treating value stream mapping as a one-time project. You create the maps, implement the changes, and check the box. But that’s a huge, costly mistake. The real power of value stream mapping in manufacturing isn't about creating a single, perfect future-state map.
Instead, its true value comes from embedding a mindset of constant refinement into your company's DNA. Think of your first map as a baseline, not a finish line. It’s a clear, data-driven snapshot that helps your team see their daily work with fresh eyes for the very first time.
Once you hit the goals on your future-state map, guess what? That future state is now your current state. It’s time to start the process all over again. This cycle is what really drives operational excellence, turning VSM from a static diagram on a wall into a living, breathing tool for growth and adaptability.
Value Stream Mapping is not the destination; it is the compass. It provides the direction and clarity needed to navigate the complex journey of eliminating waste, boosting throughput, and consistently delivering more value to your customers.
This approach ensures improvements aren't just isolated wins but become part of how you operate every single day. By repeatedly mapping, analyzing, and improving, you build a resilient organization that can thrive no matter what the market throws at it. It's all about making small, smart gains that compound over time—a core idea we explore in our guide to achieving continuous improvement in manufacturing.
Ultimately, VSM gives your whole team the framework to make better, data-backed decisions every day. It turns operational efficiency from a lofty goal into a fundamental piece of your culture.
Common Questions About Value Stream Mapping in Manufacturing
If you're just getting started with value stream mapping, you probably have a few practical questions. It's completely normal. Leaders often want to know what they're signing up for—how much time it will take, how it fits with other tools they already use, and how to keep the momentum going. Let's tackle some of the most common questions we hear.
How Long Does a VSM Project Take?
There's no single answer here, as the timeline really depends on the scope of what you're trying to map. If you're focusing on a single, well-defined production line, a dedicated cross-functional team can often get it done in just two to five days. That's enough time to walk the floor, gather the data, and draw both the current and future state maps.
But if you're aiming bigger, like mapping an entire plant from the receiving dock to the shipping door, you’re looking at a much larger effort. This kind of project could easily stretch over several weeks or even a few months. It involves a ton of coordination between different departments, digging into complex information flows, and collecting a whole lot more data. The trick is to match your timeline to the strategic importance of the product family you're analyzing.
What Is the Difference Between VSM and Process Mapping?
It's easy to get these two confused, but they serve very different purposes. Think of a process map as a microscope. It zooms way in on the specific steps inside a single task or department, detailing every single action and decision. It’s fantastic for fine-tuning a specific part of your operation.
Value stream mapping, on the other hand, is like looking through a wide-angle lens. It zooms out to give you a "door-to-door" view of the entire journey a product takes, from raw materials arriving to the finished goods shipping out. More importantly, VSM doesn't just track the physical product; it also follows the flow of information—the orders, schedules, and communications—that tells the material where to go and when.
A process map helps you see the individual trees, while a value stream map shows you the entire forest. Its real power is in spotting the systemic bottlenecks and delays between processes, which is where a lot of waste hides.
How Often Should We Update Our Value Stream Maps?
A value stream map isn't a one-and-done project. It’s a living document that should evolve with your business. Once you’ve successfully implemented the improvements from your future-state map, that map essentially becomes your new current state. And that's your cue to start the whole cycle over again.
As a rule of thumb, plan on revisiting your value stream maps at least annually. You'll also want to update them anytime there’s a major shift in your operations, like:
- Launching a new product.
- Installing new technology or equipment.
- Seeing a significant change in customer demand.
This continuous loop is what makes value stream mapping in manufacturing a true engine for ongoing improvement, not just another project that gets filed away and forgotten. It’s what helps build and sustain a lean culture.
At Wolverine Assemblies, LLC, we live and breathe lean principles like VSM to build resilient, efficient supply chain solutions for our partners. Discover how our kitting, assembly, and warehousing services can eliminate waste and lower your total landed cost. Learn more at https://www.wolverine-llc.com.
Subscribe to our weekly newsletter